
Tokenmaxxing was a vanity metric. The number that matters is the cost of a useful outcome, and the AI spend panic now sweeping enterprise IT departments is an engineering problem, not a technology verdict. The tools to cut AI bills by an order of magnitude already exist. Most companies are not reaching for them, because they are still measuring the wrong thing.
In April, Uber's CTO mentioned almost in passing on a tech podcast that the company had already spent its entire 2026 budget for one AI coding tool. The whole year's allotment, gone by spring [1]. The reason was a little embarrassing. Uber had built an internal leaderboard that ranked teams by how much AI they used, and usage shot straight up. People optimized for the leaderboard, the way people always do.
That is tokenmaxxing in a single anecdote. The premise was that AI usage equals innovation, so the more tokens your people burned, the more advanced you must be. Some companies started reporting token consumption like it belonged on the earnings call. Engineering organizations were measuring "AI maturity" by lines of generated code, prompts per developer per week, agent invocations per service. The implicit theory was that more was better. The implicit theory was wrong.
Goodhart's law, in 2026 dress
The collapse happened for a reason economists named a long time ago. Goodhart's law: once a measure becomes a target, it stops measuring anything real. Make tokens-used the score and people run up the score. The behavior the score was meant to incentivize, things like better products, faster shipping, smarter automation, quietly disconnects from the score while the score itself keeps climbing.
Uber was not alone. Amazon reportedly caught employees generating busywork to pad their AI-usage numbers, and quietly shut its internal AI leaderboard down [2]. Microsoft engineers were said to be running prompts in loops over the weekend to keep their team's numbers visible to leadership. A friend at a major bank told me their AI dashboard had become a competitive sport between divisions, with no one able to explain what any of the numbers meant for the actual business. Uber's own president said it plainly on the same podcast where the budget number leaked. The link between all that token usage and shipping something better for riders, in his words, "is not there yet." Lots more code got written. He could not tie it to a better product.
The pattern is older than AI. The Soviets ran a nail factory by tonnage and got enormous, unusable nails. The Vietnam-era body count metric bent the entire conduct of a war. Hospitals optimized for door-to-needle time and lost track of whether the patients survived. Once any of these systems made the proxy the target, the proxy and the goal drifted apart, and then the proxy started to consume the goal. AI usage as a metric is the latest entry in a long list.
The 95% problem
The strongest evidence that something has gone wrong with how enterprises measure AI is not the leaderboards. It is the field-level returns.
MIT's NANDA initiative looked at roughly 300 enterprise AI deployments last year and found that 95 percent of pilots produced no measurable P&L impact, against an estimated 30 to 40 billion dollars of enterprise spend [3]. The researchers traced the failures to integration and measurement, not to model quality. Companies running identical models got wildly different results, and more than half the budgets went to flashy sales and marketing pilots while the measurable returns were sitting in unglamorous back-office automation. People bought the technology and skipped the engineering around it.
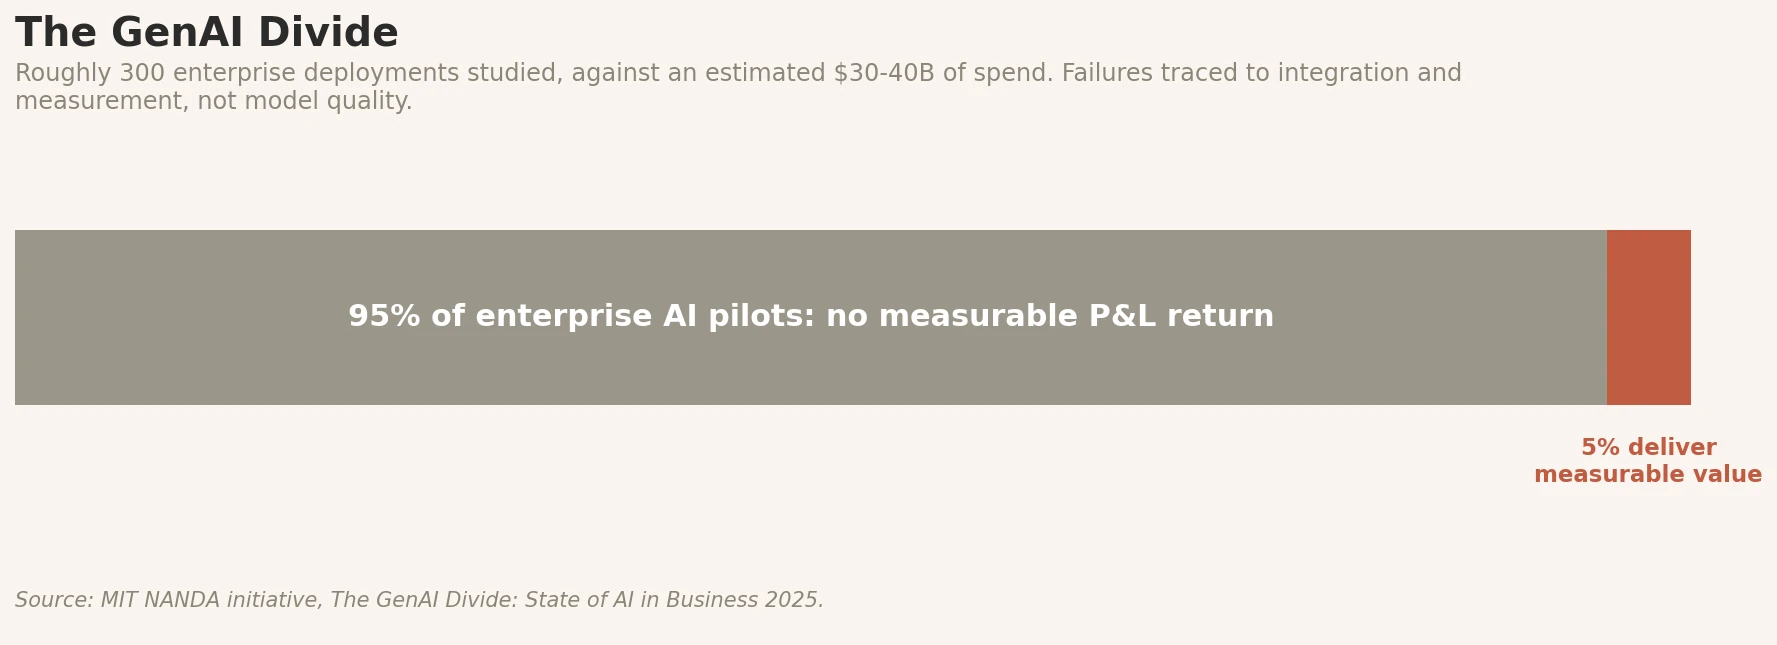 Fig. 1: MIT NANDA found that one in twenty enterprise generative-AI pilots produced measurable P&L impact across $30–40B of estimated 2024 enterprise spend. The failures concentrated in integration and measurement, not in model capability.
The model was not the bottleneck. The integration around it was, and the measurement around it was. The tooling that turned a model into a product, and the metrics that told you whether the product was working, are the things that decided which 5 percent succeeded and which 95 percent did not. Both of those are engineering problems. Neither of them is a model problem.
This is also where the dual narrative ("AI is the future" coexisting with "we cannot justify our AI spend") stops being a contradiction. The 5 percent that work are the existence proof for the technology. The 95 percent that do not are the existence proof for the engineering gap. Both will keep being true until the engineering gap closes.
The bear case, the bull case, and a third option
Coverage of the AI spend reckoning has split into two camps.
The bears have a real case. Frontier AI economics look thin once you add up the chip depreciation, the power, the salaries, the training runs that did not pan out. As the open-weight ecosystem catches up, models start to look interchangeable, and margins get squeezed at exactly the moment infrastructure bills come due. The dot-com parallel is right there. The internet was real and it rewired the world. Most of the companies that poured money into it in 1999 still went to zero. A technology can remake everything and ruin almost everyone who funded it.
The bulls say we are only now getting to the part that pays. Jensen Huang calls this the agentic phase and is spending like he means it, with a roughly twenty-billion-dollar acquisition aimed squarely at serving tokens faster. Goldman Sachs figures that agents alone could push token demand up something like twenty-four times, since a single agent task fires off a stack of model calls (plan, execute, verify, retry) to finish what a one-shot prompt used to. To the bulls, the rising bills are not waste. They are the sound of the thing finally getting used.
I think the bulls are closer to right, though for a reason I rarely hear either camp say cleanly. The bears and the bulls are both arguing about the same metric, total AI spend going up, and neither is asking the prior question. Should "total AI spend" be the headline number at all?
Tokenmaxxing was always a vanity metric. The spend panic is real but misdiagnosed. The companies that come out of the next two years with both a working AI strategy and a survivable cost structure will be the ones that throw out the leaderboard and put a different dashboard up in its place.
The number that should be on the dashboard
The number that matters has nothing to do with how many tokens you burn. It is the cost of a useful outcome, what I usually call intelligence per dollar and intelligence per watt. Grading a company on token count is like grading a factory on how much power it pulls off the grid instead of on what rolls out the door. Nobody puts their electricity bill on a billboard.
Tokens are electricity. The only question worth asking is what you built with them.
What should the dashboard look like instead? Concrete, business-tied numbers that vary by function but share the same shape.
Customer support shows cost per resolved support ticket, not tokens consumed by the support bot. The unit of work is a ticket actually closed and not reopened in seven days. Token spend is the input. Resolution is the outcome.
Engineering shows cost per merged pull request that survives 30 days in production. Code that gets reverted was never productivity, and the 30-day window is where the gap between "AI wrote it" and "it shipped" actually shows up.
Sales, finance and operations have their own units: cost per qualified lead, per processed insurance claim, per closed bookkeeping period, per drafted contract reviewed and approved. Whatever the unit of work is in your business, that is the metric.
For agentic systems specifically, the metric is cost per autonomous workflow completion. The agent ran a multi-step task end-to-end, the task closed, and the human did not have to redo it. Most companies are missing this metric entirely.
One ratio is worth a quarterly chart: dollars of inference per unit of business work, plotted as a line. The slope of that line is your AI engineering organization's actual productivity number. If it is flat or rising, you are buying more electricity. If it is falling, your engineering is improving. Fewer dollars of model spend per unit of customer-visible work.
Every one of these is harder to collect than a token count. That is precisely what makes it worth collecting. A metric that is easy to measure and uncoupled from business value is exactly the metric you want to avoid putting on a leaderboard.
The engineering levers most companies are not pulling
There is a corollary to the dashboard story that the bears miss completely. The reason most enterprise AI looks unaffordable is that almost no one is doing the engineering that would make it affordable.
I read "we cannot justify our AI spend" as an engineering confession more than a verdict on the technology. The tools to get the same result for a fraction of the cost already exist, and most companies are not reaching for them.
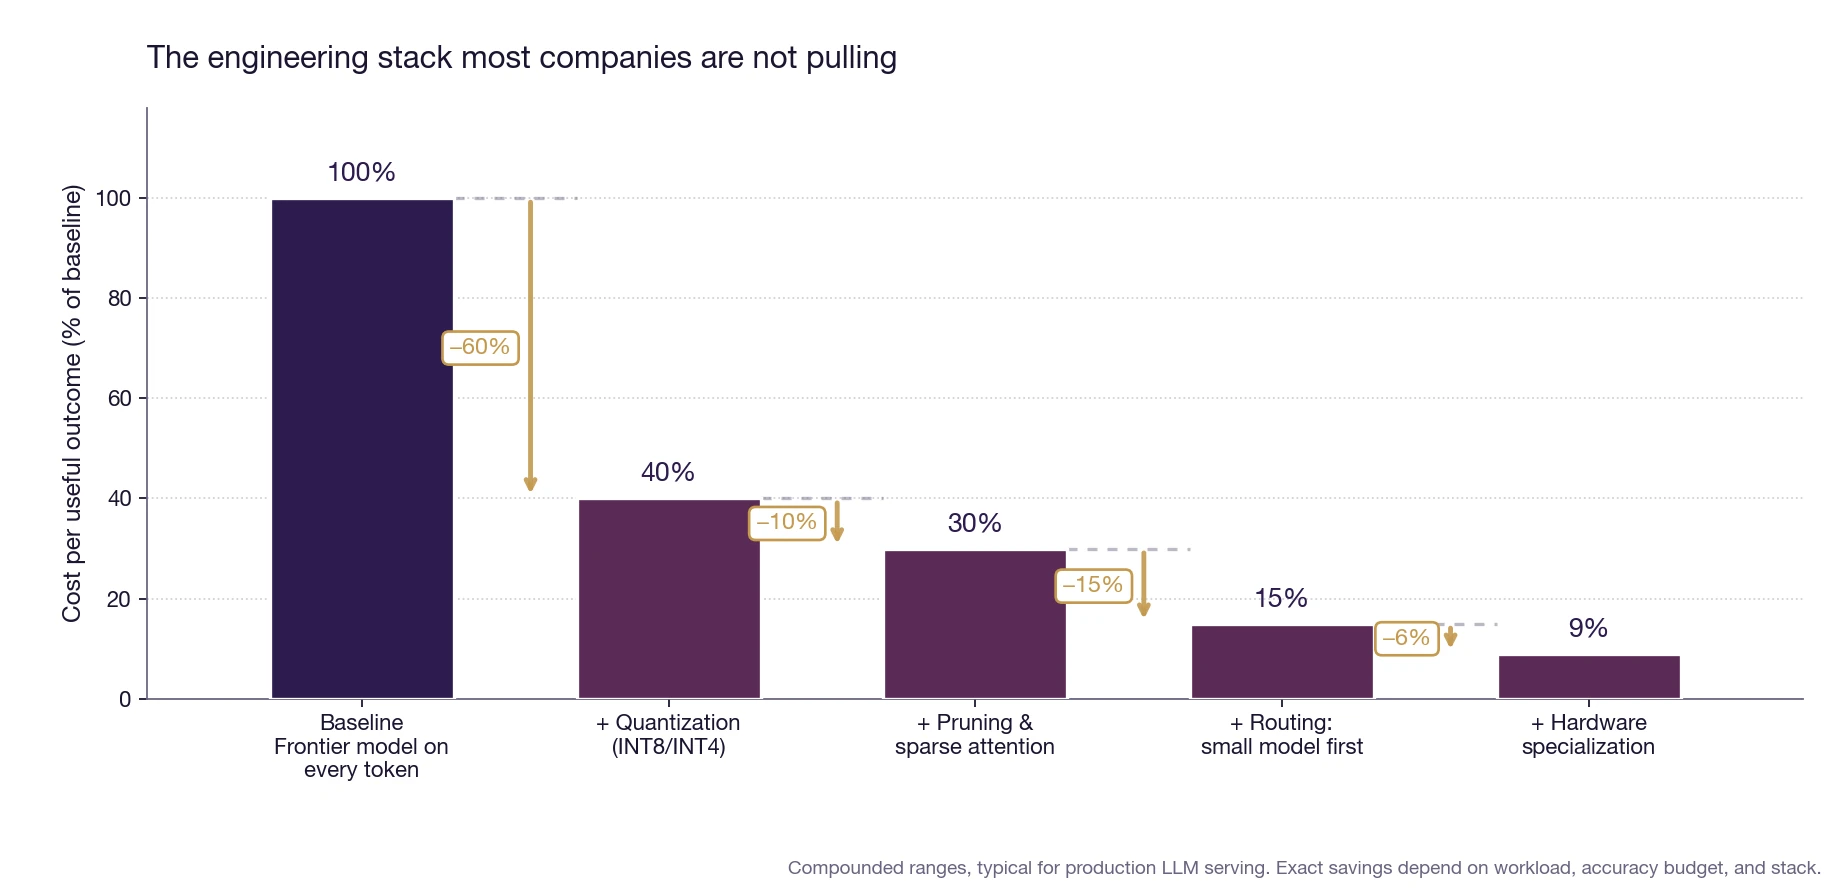 Fig. 2: The engineering levers that already exist (quantization, pruning, routing, and hardware specialization) stack multiplicatively to compound cost reductions. A workload running unmodified on a frontier model pays roughly 10x what an engineering-aware deployment does.
You can shrink a model so each answer is cheaper to run, which is most of what I do day to day. Quantization and pruning together can take 60 or 70 percent off the cost of serving a model, and most shops have not touched them [4]. You can route, handing the easy 80 percent of requests to a small cheap model and saving the expensive frontier model for the hard 20 percent. You can put the work on silicon built for it instead of aiming the most general-purpose, most expensive hardware at every token that comes through. Each of these levers individually cuts a meaningful fraction of cost. Stacked, they compound to roughly 10x.
A workload running unmodified on a frontier model (biggest available model, FP16 weights, every request goes to the same endpoint, generic GPU inference) pays roughly ten times what the same workload would cost with the engineering levers actually pulled. That is not theory. That is the gap between a casual deployment and a production-engineered one, measured directly on real systems.
The companies torching their budgets are mostly running their biggest model on everything, all the time. That is a decision, and decisions can change. The companies that get the cost-per-outcome number down by an order of magnitude over the next two years are not going to have a magic compression breakthrough. They are going to do the unglamorous engineering that already works.
The cost story is not "AI is too expensive." It is "you are paying ten times what you need to, because you did not engineer the deployment."
Why falling prices and rising bills are both true
There is one more piece of the picture that confuses everyone the first time they see it, and it explains the whole moment. Per-token prices keep falling, fast, and total AI bills keep climbing at the same time. That looks like a contradiction. It is not.
It is the Jevons paradox, the 19th-century observation that gains in efficiency multiply consumption rather than curbing it. Cheaper steam engines made coal demand explode, not collapse, because coal was suddenly worth burning in places no one had bothered with. Cheaper electricity made electricity demand explode. Cheaper computing made computing demand explode. The pattern is so reliable it has its own name. AI is the latest instance.
The modern numbers are wilder than anything from the steam age. GPT-3-level capability cost about 60 dollars per million tokens when it first went public in late 2021. The same capability now goes for six cents or less. That is a thousandfold drop in less than five years. Epoch AI clocks the rate of decline at anywhere from 9x to 900x per year depending on the task class [5].
Demand did what demand does. Google processed under ten trillion tokens a month two years ago. At I/O last month, Sundar Pichai said the figure had passed 3.2 quadrillion, roughly a 300x jump over the same stretch the prices were collapsing [6]. The same pattern shows up at the enterprise level. A bank that was spending a million dollars a quarter on AI inference in 2024 is now spending five million a quarter. The unit price came down by an order of magnitude. The bill went up by 5x. Both are true. The first caused the second.
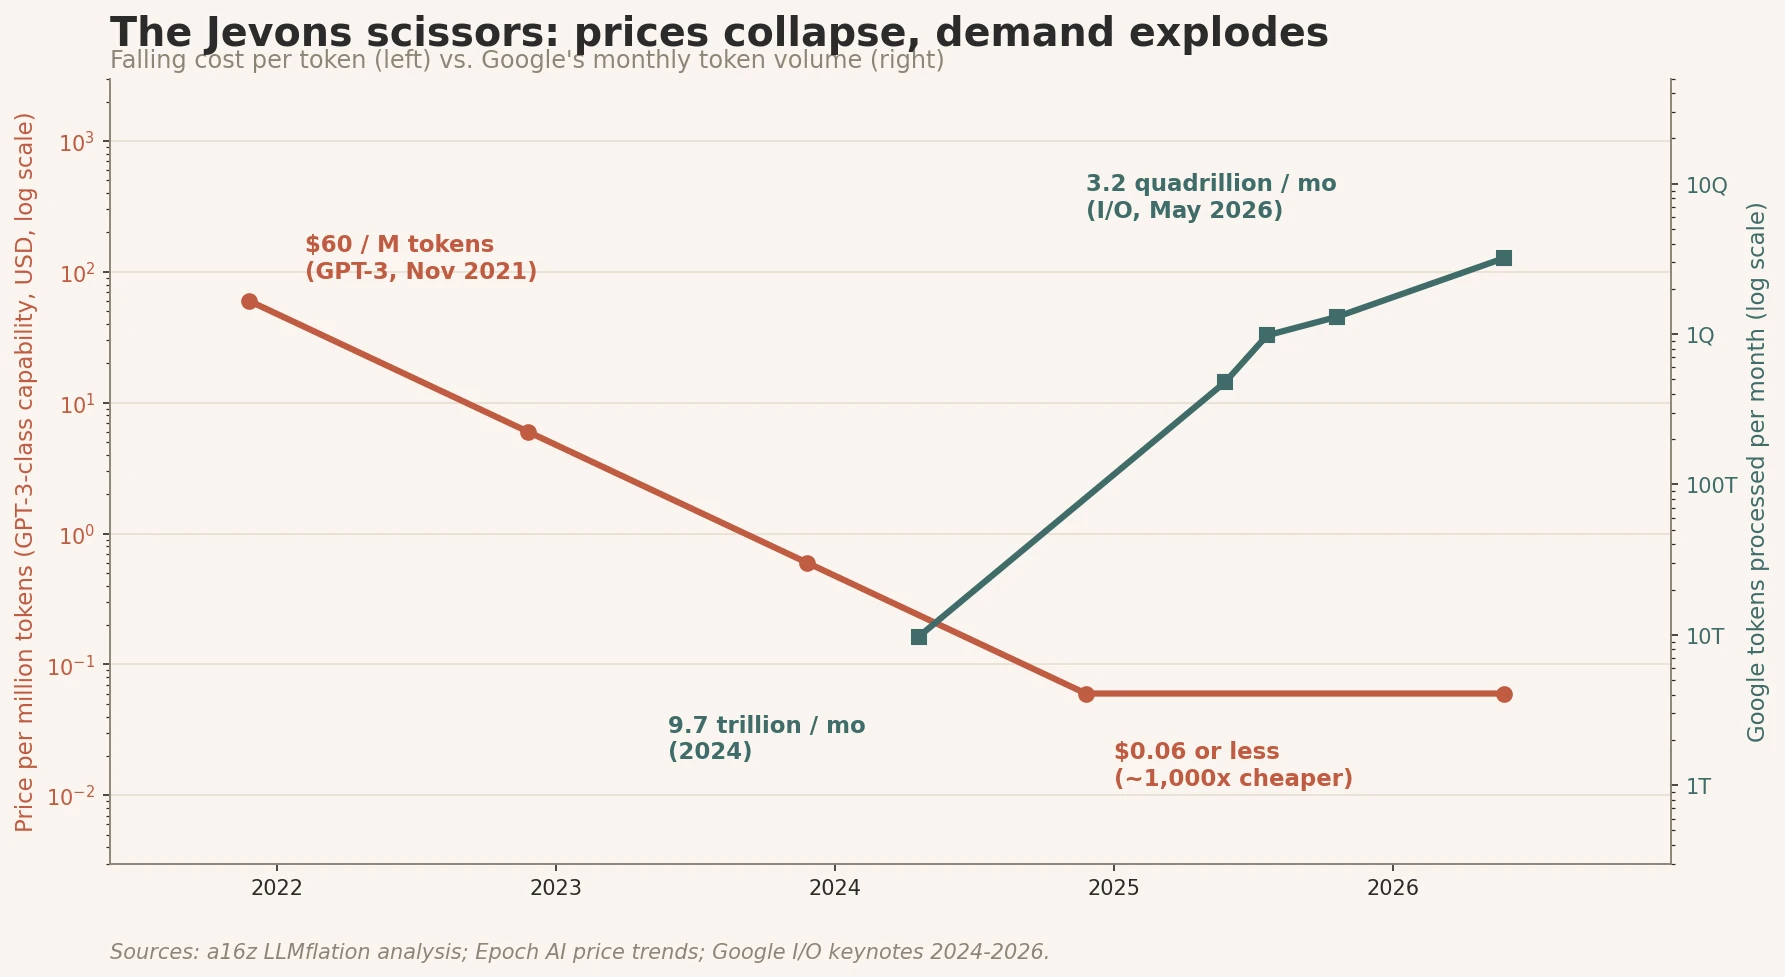 Fig. 3: Falling token prices and exploding token demand from 2021 through 2026. Per-token prices fell by roughly three orders of magnitude over the period. Token consumption grew by roughly two-and-a-half. Sources: a16z LLMflation; Epoch AI; Google I/O keynotes.
This is also why "the AI bubble is going to pop because spend is unsustainable" is the wrong reading of the same data. The spend is unsustainable for the companies running the biggest model on everything with no engineering. It is sustainable, and improving in unit economics, for the companies pulling the levers.
What a CFO should actually do this quarter
If you run an enterprise AI budget, the practical playbook is shorter than the analysis suggests.
First, kill the usage leaderboard. Whatever you are using internally to rank teams or developers by AI consumption, take it down today. The leaderboard is incentivizing the exact behavior you do not want, and the longer it is up, the more your cost base bakes in habits you will have to unwind later. Replace it with one or two business-tied outcome metrics per function: cost per resolved ticket for support, cost per surviving merged PR for engineering, cost per qualified lead for sales.
Second, demand a cost-per-outcome number on every AI initiative. No new AI deployment gets greenlit without an explicit unit-economics target. "We are going to use AI to do X" is not a proposal. "We are going to use AI to do X at $Y per unit, measured by Z, reviewed quarterly" is a proposal. The proposals that cannot be written in the second form are exactly the ones that will not survive contact with the budget.
Third, fund the engineering, not just the inference. The reason 95 percent of enterprise AI pilots show no measurable return is that companies are funding the model and not the integration around it. Quantization specialists, routing infrastructure, evaluation harnesses, observability, cost-attribution: these are not glamorous line items. They are the line items that decide whether you are in the 5 percent or the 95 percent.
None of this requires waiting for a new model release or a hardware announcement. All of it is available now, on the technology you already have. The companies that come out ahead in the next two years will not be the ones who used the most AI. They will be the ones who stopped counting tokens and started counting what the tokens produced.
References
[1] Fortune. "Uber's COO says it's getting harder to justify the company's AI spend," May 2026. References prior reporting that Uber exhausted its entire 2026 budget for Claude Code in roughly four months after deploying it in December 2025, after an internal usage leaderboard incentivized teams to maximize token consumption.
[2] Financial Times. "Amazon scraps AI leaderboard to stop workers chasing usage scores," May 2026 (paywalled). Open coverage of the same story: HRD America. Similar dashboard patterns reported across Microsoft and several large banks: usage incentives produced measurable gaming behavior (looped prompts, generated busywork, prompt-padding) without observable downstream productivity gains.
[3] MIT NANDA Initiative, State of AI in Business 2025. Widely covered analysis showing 95% of enterprise generative-AI pilots produced no measurable P&L impact across $30–40B of estimated enterprise spend. Fortune coverage, Aug 2025. Failures concentrated in integration and measurement rather than model quality.
[4] See deeper treatment in Why Quantization Won, and Where Pruning Survived and The Real AI Cost Problem: A Full-Stack View of Cheaper Inference: layered compression and serving optimizations routinely take 60–90% off inference cost without measurable accuracy loss. The four-layer stack (algorithm, compiler, runtime, hardware) is where the 10x compounded gains come from.
[5] Andreessen Horowitz. "LLMflation: LLM inference cost is going down fast," 2024–25. Epoch AI's "How fast are LLM inference costs falling?" tracker (2025–2026) measures price-per-capability declines of 9x–900x per year depending on the task class.
[6] Sundar Pichai. Google I/O 2026 keynote (official Google blog), May 2026. Pichai recapped Google's monthly token processing rising from under 10 trillion (mid-2024) to roughly 480 trillion (I/O 2025) and to 3.2 quadrillion (spring 2026), a roughly 300x increase concurrent with order-of-magnitude price drops. Companion coverage: TechCrunch.
Discussion
Sign in with GitHub to leave a comment or react. Threads are public and live in this site's GitHub Discussions.